The Messy Church style of service has grown in Australia since its introduction here in 2010. So which churches are using it?
Messy Church typically includes hands-on creative experiences, a celebration and a meal. It does not prioritise either the needs of children or adults but intentionally welcomes and provides for all ages.
Results show that Messy Churches exist across a wide range of denominations, church sizes and locales. Most commonly though, they are found in Uniting, Anglican, Baptist and Salvation Army churches in Australia.
Which churches are using the Messy Church format?
Results from five data sources* show that Messy Churches exist across a wide range of denominations, church sizes and locales.
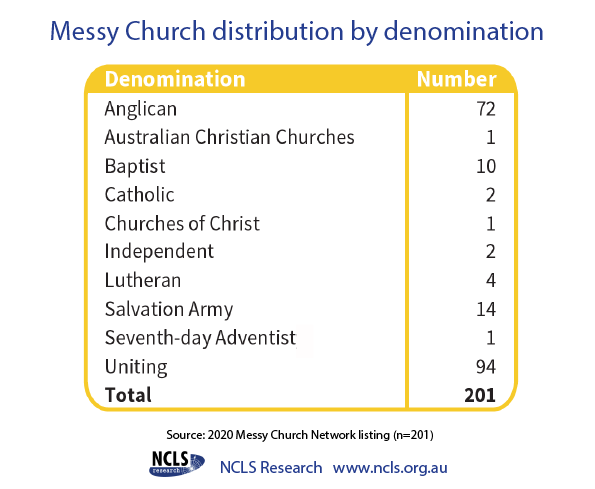
What is clear, as indicated by the Australian Messy Church Network, is that for 2019 and 2020 there were around 200 member churches. Of the member churches in the network, the denominations that most embraced the format were Uniting (94 churches), Anglican (72 churches), Salvation Army (14 churches), and Baptist (10 churches). See Table below for more detail.

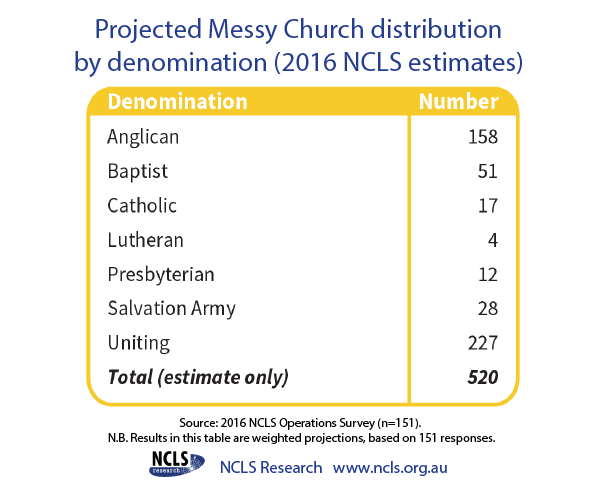
Using results from 151 respondent churches in the 2016 NCLS Operations Survey, NCLS Research projected estimates across Australia to suggest that somewhere in the vicinity of 520 Australian churches are using the Messy Church format.
Of the spread across denominations, some 227 Messy Churches are likely in Uniting churches, 158 are likely in Anglican, 51 in Baptist, 28 in Salvation Army, 17 in Catholic, 12 in Presbyterian and 4 in Lutheran congregations.

Comparison of both tables above, shows that small levels of Messy Churches in some denominations (such as Australian Christian Churches, Churches of Christ and Seventh-day Adventist churches) have not been detected in the NCLS data, due to the non-census nature of the survey. Therefore, while the numbers above are only an estimate based on participation in the 2016 NCLS, the use of Messy Church in other denominations may be even higher.
Are Messy Churches more common in certain sized churches?
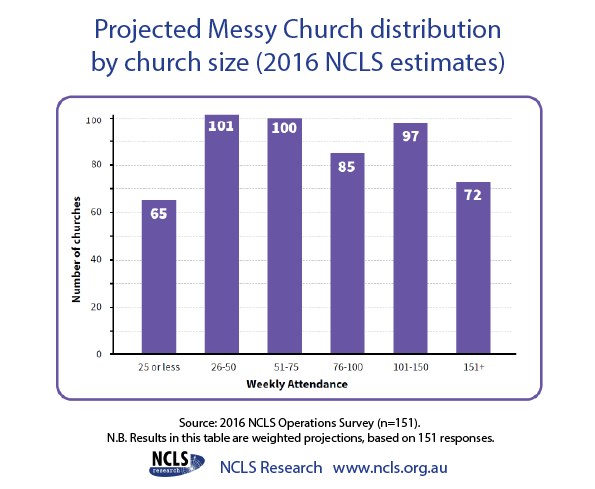
In the 2016 NCLS data, the distribution of Messy Churches is spread fairly evenly across different congregation sizes. NCLS projections suggest that Messy Churches are slightly more common in medium churches of 26-50 or 51-75 attenders (around 100 Messy Churches in each of these size groupings); followed by larger churches of 101-150 attenders (97 Messy Churches); and are slightly less common in very large churches, or very small churches.

Are Messy Churches found more often in particular locations?
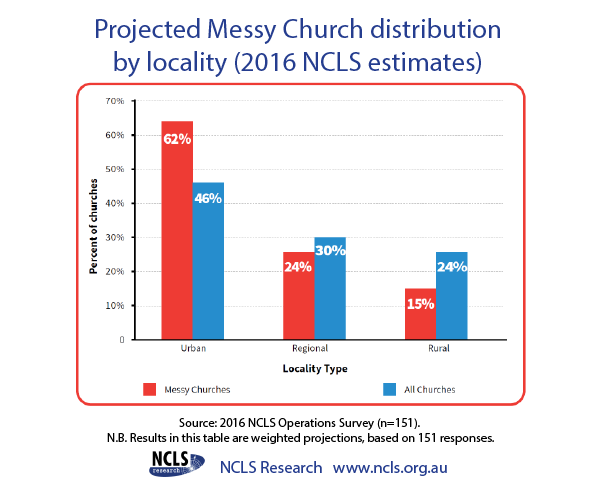
When it comes to population density the NCLS projections showed Messy Churches are more commonly found in urban areas at 62%. While regional areas comprise 24%, and rural areas comprise 15%.
Importantly, the NCLS projections show that the distribution of Messy Churches across differing localities does not match the distribution of churches generally. (See figure below.)
These results suggest that higher proportions of urban churches use Messy Church, than regional or rural churches. The prominence of the Messy Church concept in urban settings shows that families or intergenerational groups in cities and suburbs are engaging with the dynamism of an all-in worship environment that Messy Church provides.

Considerations for ministry
As population densities decrease, it appears that so does the use of the Messy format. Whether this is due to less leaders being available to run such a venture, less younger people in attendance, or a preference for more traditional styles of worship, remains a point of clarification for churches in areas of smaller populations, including rural, regional and remote areas. In contrast, urban churches are displaying a higher preference for running Messy Churches in their city and suburban contexts.
What is clear overall, is the trend that this style of alternate worship and intergenerational spiritual activity seems to be applicable across faith traditions and church sizes. As multiple generations of churchgoers gather together to explore faith in creative ways, this style of worship seems to be spreading the Mess in positive and inclusive ways, as well as spreading God's love and sharing the living Word.
* The 5 sources of data for Messy Churches in Australia: Mapping the Landscape include: The Australian Messy Church Network’s 2018 Survey Responses, 2019 Church Listing, 2020 Church Listing; The 2016 NCLS; 2016 NCLS Operations Survey with Messy Church listing and weighted results, 2016 NCLS Aggregated Church Attender Data.
Kathy Jacka and Sam Sterland, NCLS Research with Rod Bennett, WildHive Studios.
Who is going Messy?
Attendance, change and intergenerational mix in Messy Churches in Australia.
Is being Messy healthy?
Characteristics, health and innovations of Messy Churches in Australia.


